Version 4.0
HTML version by David Christianson and Chung Kwok
This research was funded in part by Office of Naval Research Grants 90-J-1904s and N00014-94-1-0060, by National Science Foundation Grants IRI-8957302 and IRI-9303461 and by a donation from Apple Computer.
All rights reserved. Use of this software is permitted for non-commercial research purposes, and it may be copied only for that use. All copies must include this copyright message. This software is made available AS IS, and neither the authors nor the University of Washington make any warranty about the software or its performance.
When you first acquire this software please send mail to bug-ucpop@cs.washington.edu; the same address should be used for problems."
The primary function of PDB is to allow the user to schedule planning problems to be run by the planner, record the actions taken by the planner, and then reconstruct that information in a meaningful way. Since UCPOP does extensive search in plan-space, PDB focuses on recording and presenting plan-space search trees generated by the planner.
PDB is an interactive application which makes the UCPOP planning process more accessible to the user by the use of graphical interfaces to the planning process. It is intended to be used in several ways:
PDB exists because of the difficulty involved in performing planner research without adequate visualization tools. In the case of UCPOP, users who were trying to use the planner as well as programmers trying to improve and debug the system were having to wade through extensive trace information generated by the planner. PDB evolved as a way of presenting this information in a graphical format in order to make these tasks easier.
Recording Plans From The Lisp Listener To start PDB, just run (pdb-setup) in the UCPOP package. To start recording planning sessions, use PDB-RECORD:
(pdb-record &key (record-firings nil))
Then invoke the UCPOP planner. To stop recording, use PDB-STOP:
(pdb-stop)
If you use the def-searchprocedure to wrap around search functions, all planning sessions will be recorded when even the Recording toggle button in the shell. You can turn off the recording by clicking on the Recording toggle button in the shell (please refer to the Shell window).

| Windows | Refresh | Redisplays the window contents. |
|---|---|---|
| Find | Displays a list of active subwindows. Selecting a window will bring it to the front of the screen. | |
| Remove all | Closes all active subwindows. | |
| Quit | Close this window. | |

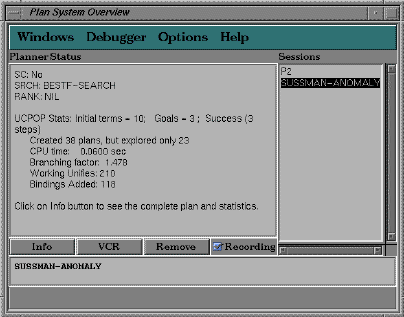
The first window opened by PDB is the Plan System Overview Window. The right hand side of this window maintains a list of recorded planning sessions while the left hand side displays the state of the planner.
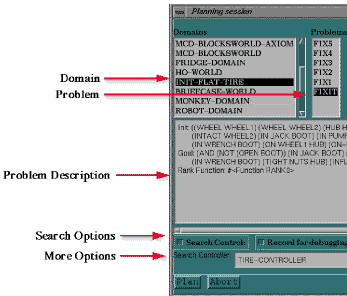 In order to start a new planning session, select New Session from
the Debugger menu. You will then be asked to specify the problem
you want to solve and the search method to use via a dialog box. On
the top left of the dialog box is a list of domains. Next to it is a
list of problems. When the item ``Any'' is selected from the domain
list, all problems are listed: otherwise this list only contains
problems from the currently selected domain. Once a problem is
selected, a complete description of the problem is presented in the
area below the domain and problem lists.
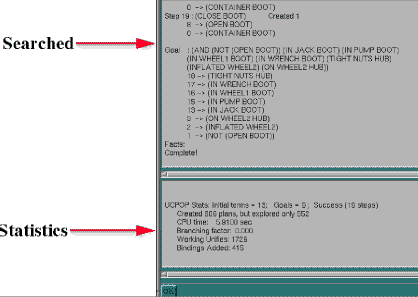 Once you've specified the planning options and clicked the Plan
button, PDB calls UCPOP to begin planning. The Plan System
Overview Window displays a progress report on planning and returns the
results of planning when done. These
results include a short description of the last plan searched, which
will be the solution if the planner was successful. PDB prints
plans in the following manner: the initial state is printed first,
then the steps in order to the goal state. Only the preconditions of
the steps are displayed. Each precondition has a number to its left
representing the step which supports that precondition. If the plan is
not complete, any unsupported preconditions appear with question marks
instead of numbers on the left,
while threats are identified by the step number of the threatening
step, shown to the right of the threatened condition.
| Windows | Please refer to General window layout | |||||||||||||
| Debug | New Session | Execute a new planning problem. This brings
up a dialog window containing the following options:
| ||||||||||||
|---|---|---|---|---|---|---|---|---|---|---|---|---|---|---|
| New Browser | Browse domains, problems, and search control. | |||||||||||||
| Open Session | Open a VCR window on a session. | |||||||||||||
| Delete Session | Delete a session so that it will no longer appear in the window. | |||||||||||||
| Clear Session | Delete all sessions. All sessions will be lost. | |||||||||||||
| Options | Reset Options | Reads back the defaults saved in .plandebugrc | ||||||||||||
| Save Options | Writes defaults out to .plandebugrc | |||||||||||||
 The Sessions window (right) shows the sessions recorded by the system.
The PlannerStatus window (left) shows various information about the session selected.
| Info | Display the result of the current session. |
|---|---|
| VCR | Display a trace of the current session. |
| Remove | Remove the current session. |
| Recording | Toggle plan recording on/off. |
Sessions
|
|---|
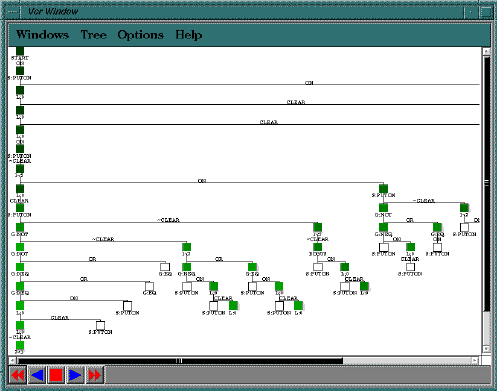
VCR Windows provide the user with a graphical depiction of the search space explored by the planner during a given planning session. Once the user has seleted a session in the Plan System Overview Window, they can create a VCR Window for that session either by selecting New VCR Window from the Debug menu, or by pressing the VCR button in the window itself.
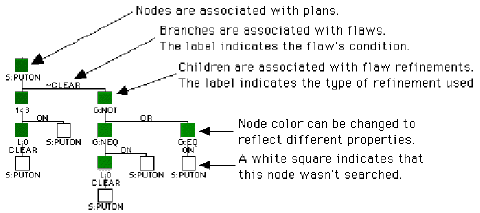
The tree is formatted so that the left hand side of the tree leads to the last node encountered by the planner. If the solution was found, this will be the solution path. Note that the formatting algorithm puts nodes near the root of the tree farther apart than nodes at the leaves, so that sometimes you will have trouble using the VCR Window to view all the children of some nodes. You can solve some of these problems by changing or restricting the display of various nodes in the tree via the Tree and Options menus.
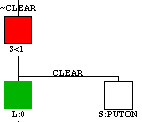 The label
below nodes refers to the reason for which the plan is made. For example
in the figure above "S:PUTON" means a new step "PUTON" is added,
"L:0" means a new link to step 0 is added, and finally
"3<1" means an ordering constraint (from promotion or demotion) is added.
The red node is the currently selected node. You can press the left or middle button.
| L | Select Node: Centers the cursor over this node. If the cursor is already at this node, PDB will open a plan window on that node. |
|---|---|
| M | Describe object: If Composer is running, PDB will open a Composer window on the partial plan associated with this node. |
The green is a visited node. A node (plan) is visited if the plan refined it during planning.
The white node is an unvisited node. The planner has not refined the plan during planning.
The word "CLEAR" above the horizontal line represents the open condition being resolved by the different siblings plans connected by the line.
| Windows | Please refer to General window layout | |||||
| Tree | Print the current window. Asks for filename via dialog. | |||||
| All Nodes | Display all nodes in the tree. | |||||
| Steps Only | Display nodes for plans with newly added steps. | |||||
| Searched Only | Display only those nodes that have been searched. | |||||
| Solution Only | Display solution node only (if found). | |||||
| Solution Path Only | Display nodes on solution path (if found). | |||||
| Expand Node | Display the children of the current plan. | |||||
| Contract Node | Do not display the children of the current plan. | |||||
| Expand Branch | Display the branch rooted at the current plan. | |||||
| Contract Branch | Do not display the branch rooted at the current plan. | |||||
| Options | View | Change the node picture of the tree nodes to one
of the following
| ||||
| Labels | Label the node branches with conditions branched on:
| |||||
| Resize | Shrink or enlarge the displayed search tree by a constant factor. | |||||
| Backup the VCR until stop button is pressed. | ||
| Backup the VCR to the plan visited just prior to the current one. | ||
| Stops the VCR traversal animations. | ||
| Progress the VCR to the next visited plan. | ||
| Progress the VCR until a mouse button is pressed. |
| Plan Tree Nodes | |
|---|---|
Plan Window Markers
|
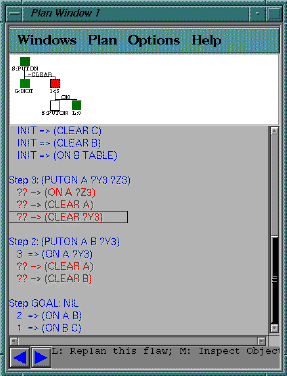
| Windows | Please refer to General window layout | |||||
| Plan | Refine | Refine the current plan. Brings up a dialog with search options. | ||||
|---|---|---|---|---|---|---|
| Search Limit | Number of nodes to search before stopping. | |||||
| Choose Flaw | If yes, the user must select from a list of current flaws. Search limit will be set to 1. | |||||
| Record Firings | Yes to record all search control rule firings(slow). | |||||
| Print the current window. Asks for filename via dialog. | ||||||
| Inspect | Inspect the current node. | |||||
| Options | Graphics | Change the representation of the plan
| ||||
| Verbosity | Control detail or representation
|
Plan Tree Nodes
| |||||||||
|---|---|---|---|---|---|---|---|---|---|
Plan Structures
|
 |
Go to the previous visited node. |
 |
Go to the next visited node. |
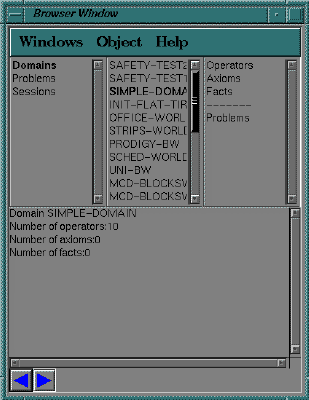
| Windows | Please refer to General window layout | ||||
| Object |
|
||||
 |
Scroll the browser menus towards the top of the heirarchy. |
 |
Scroll the browser menus towards the bottom of the heirarchy. |
| L | Select Object | Clicking on an item in one of the browser menus will bring up the menu associated with that item(if any) in the pane to the right of the selection, as well as the object associated with that item(if any). |
|---|
You can define (setf *pdb-use-colors* nil) in your Lisp startup file (e.g. .clinit.cl on Allegro Common Lisp), or anytime before loading PDB. This will cause PDB to adopt monochrome defaults for its windows.
| Variable | Description | Default | Note | |
|---|---|---|---|---|
| *shell-width* *shell-height* |
Width and height of the shell window. | 600 400 |
It is best not to set these variables below the defaults. | |
| *vcr-width* *vcr-height* |
Width and height of the VCR window. | 800 600 |
||
| *plan-height* *plan-width* |
Width and height of the plan window. | 500 400 |
||
| *browser-height* *browser-width* |
Width and height of the browser window. | 500 400 | ||
| *vcr-show-progress* | When drawing the VCR window, a window indicating drawing progress will be displayed if this variable is set to t. | t |
There are other variables that customize colors and fonts as well. Please refer to the file "pdb/shell.lisp".
Some of these problems are resulted from bugs in CLIM2.0 implementation on AllegroCL 4.2. When you send bug reports, please check the list below first.
If PDB should ever crash, you can either continue by choosing one of the several continue options provided by your lisp system, or restart PDB. You can simply restart by issuing (pdb-setup) again. Restarting will erase all previous sessions. Please also include a stack trace (for example using :zoom in Allegro CL) and send a message to bug-ucpop@cs.washington.edu.
If the planner is very similar to UCPOP, only functions specific to the planner need to be redefined. The file vcr-external.lisp contains the interface functions called by PDB to display plan components. You just need to redefine these functions for your planner. To change the PDB- Lisp-interpreter interface for your planner, modify the file vcr-interface.lisp.