Supplementary Graphs

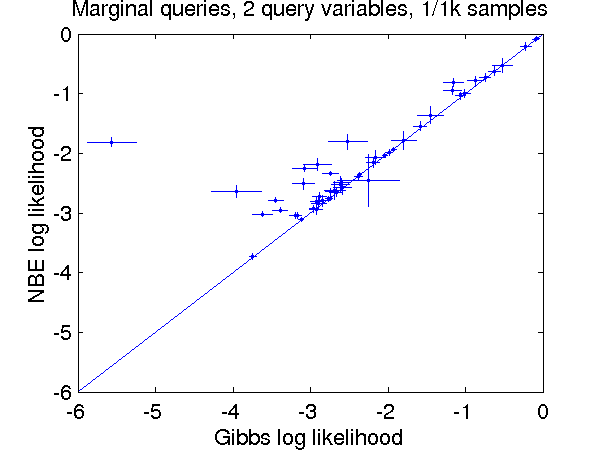
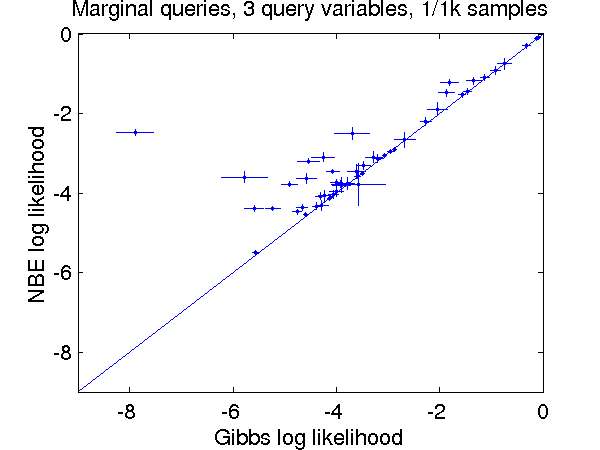
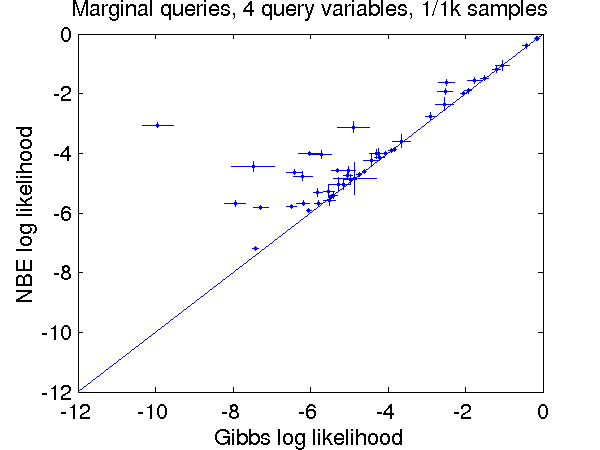
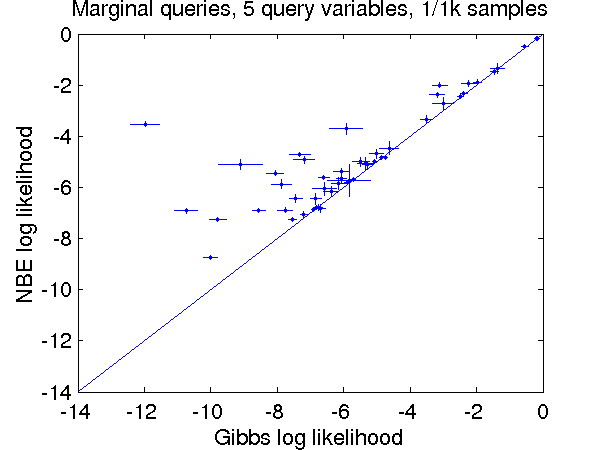
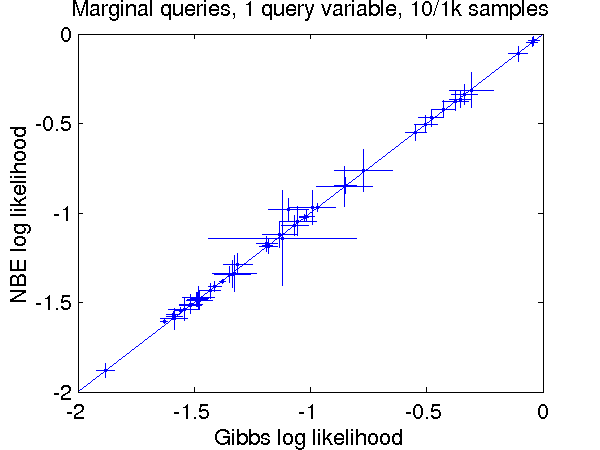
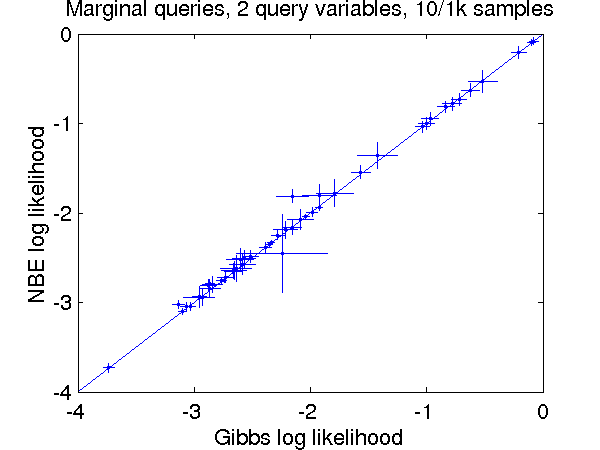
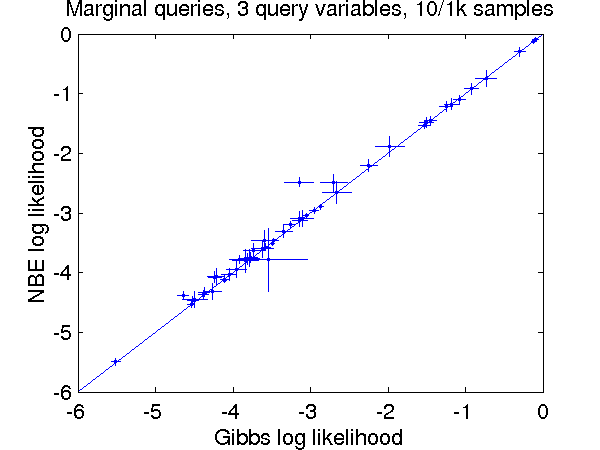
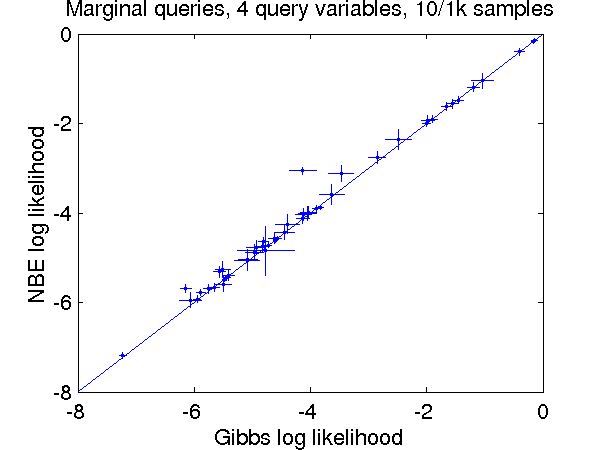
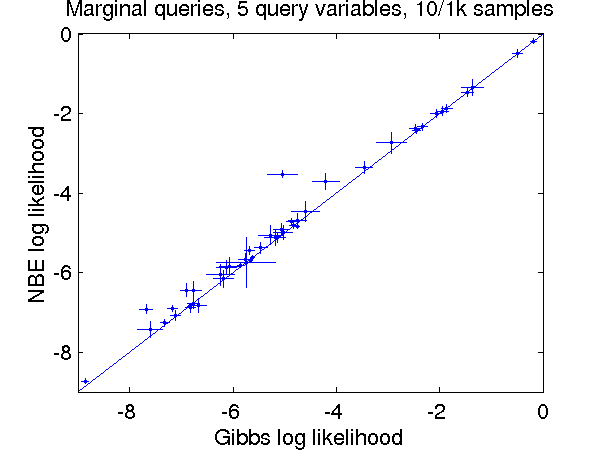
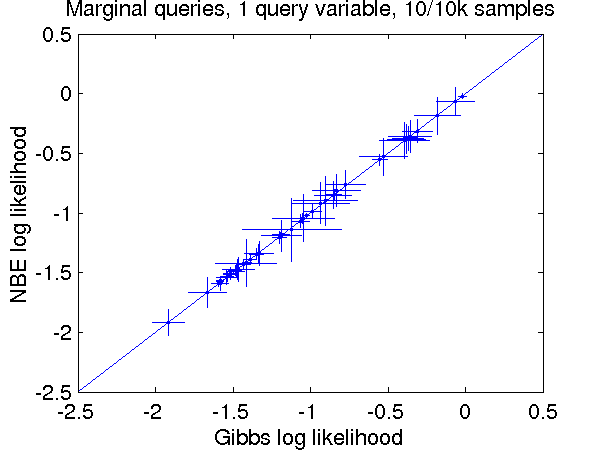
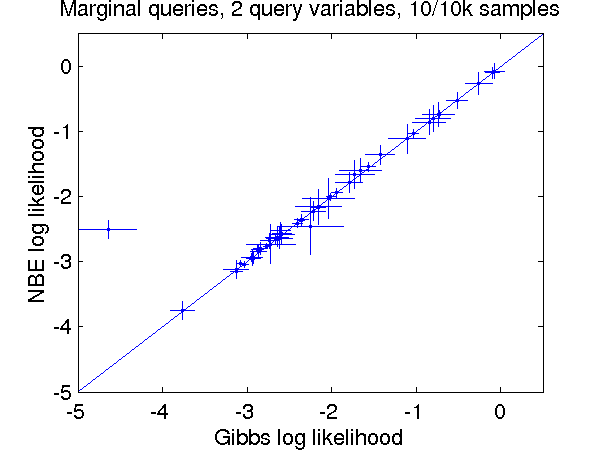
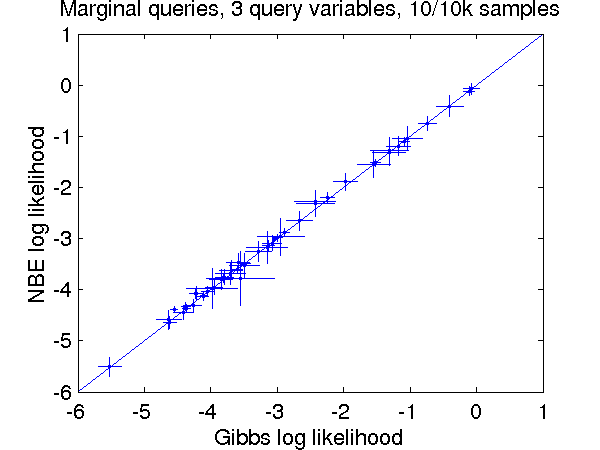
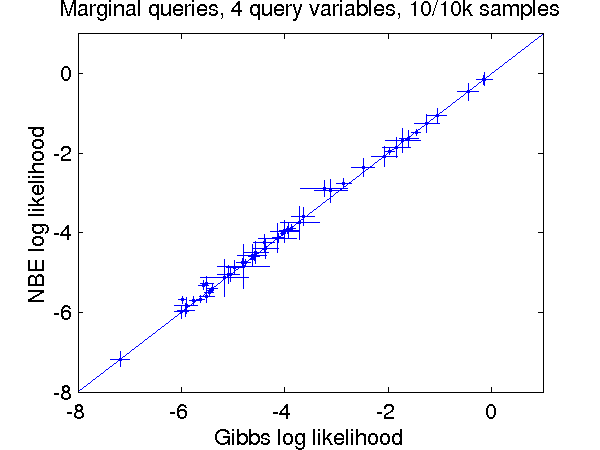
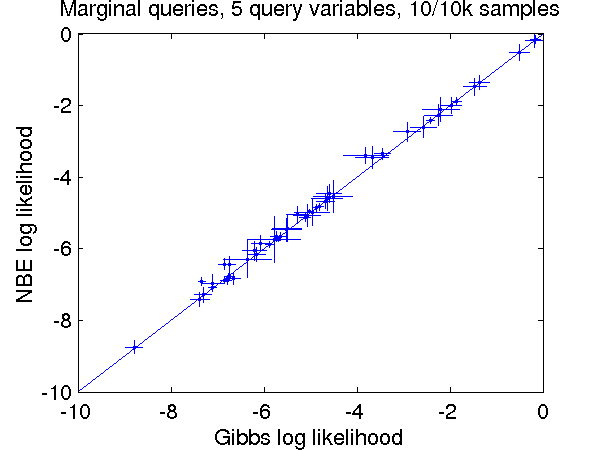
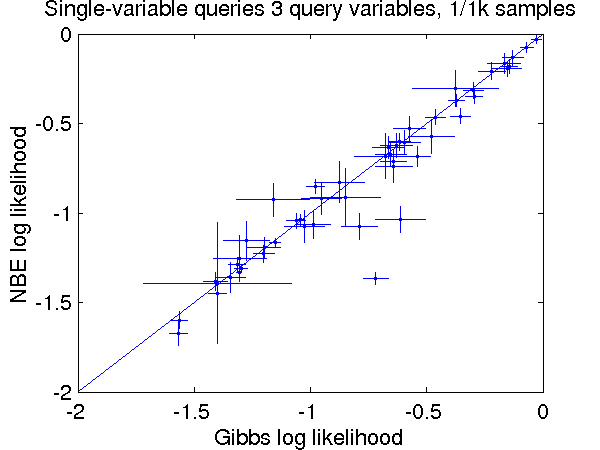
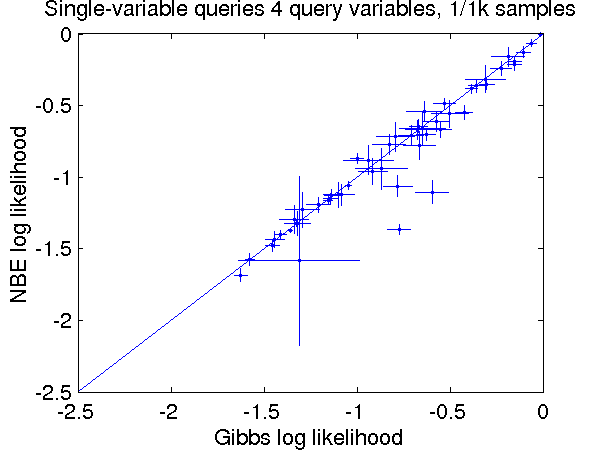
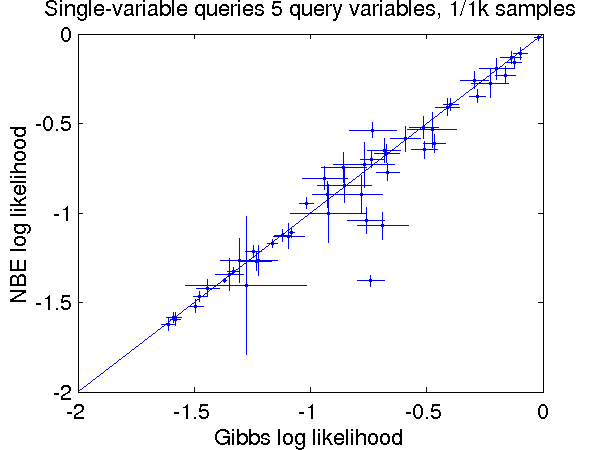
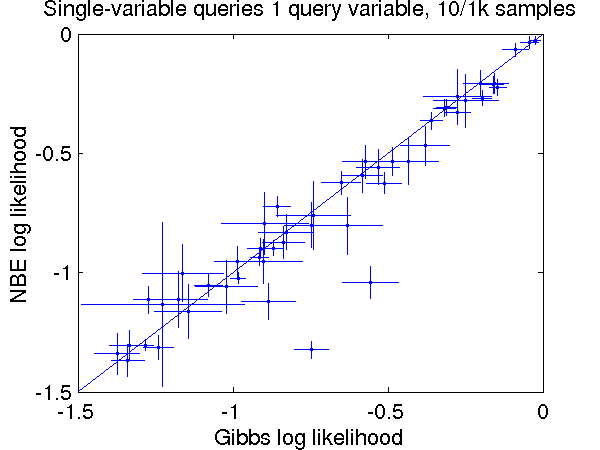
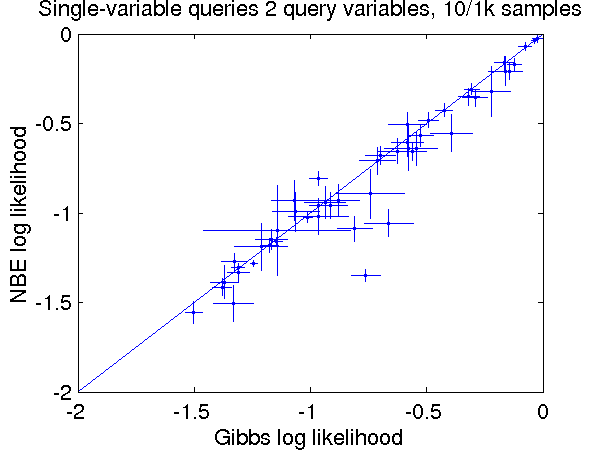
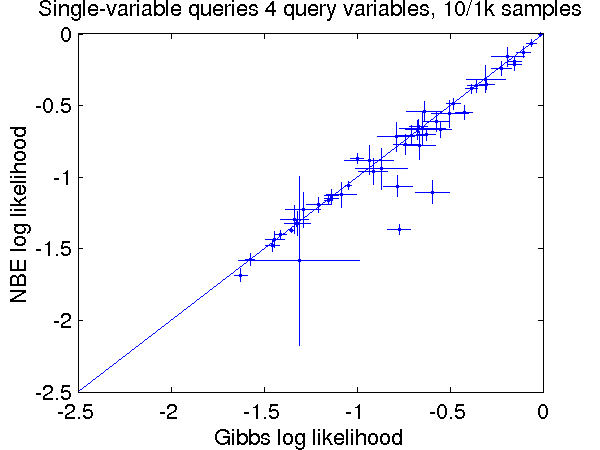
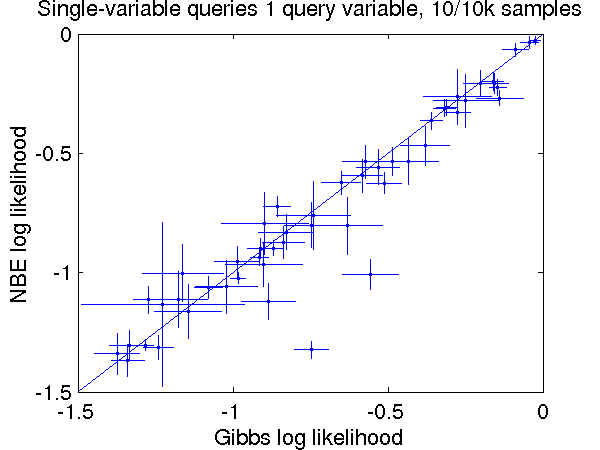
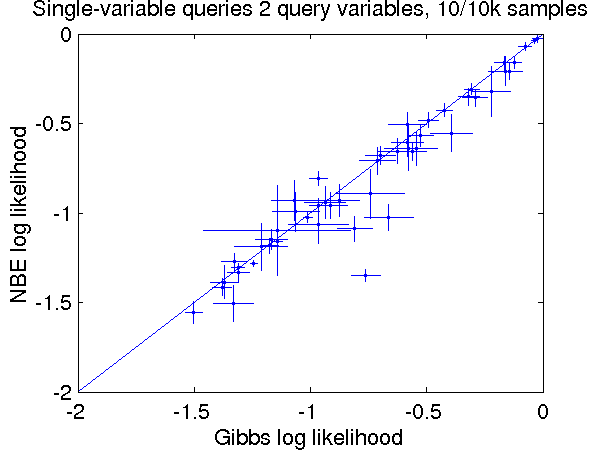
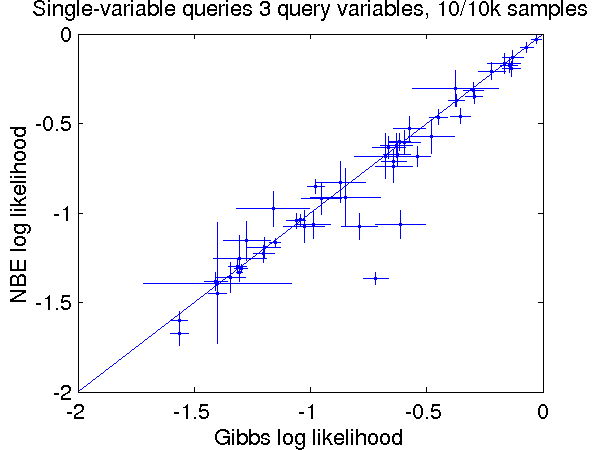
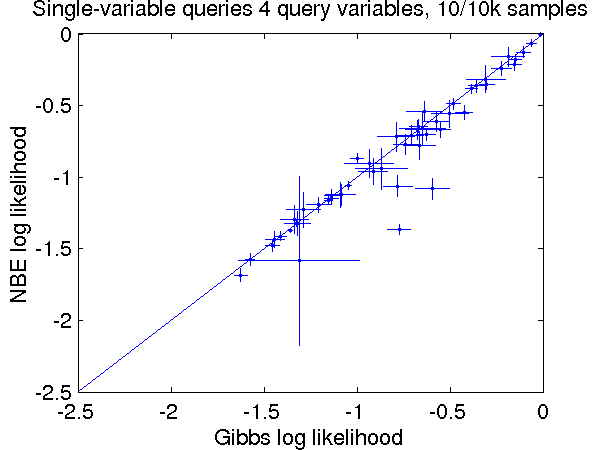
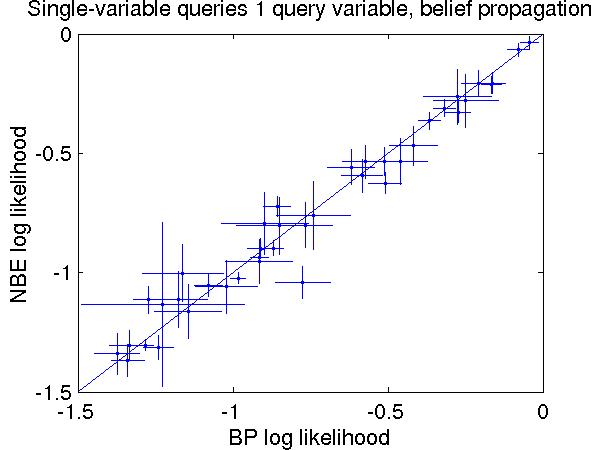
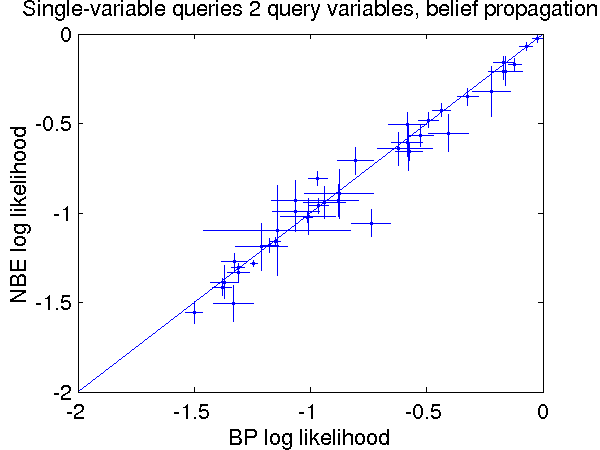
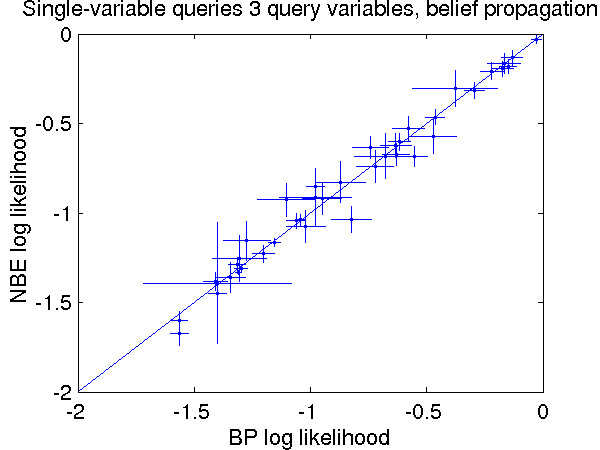
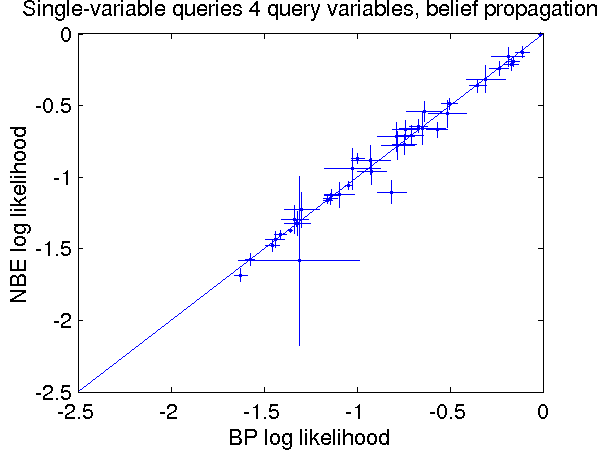
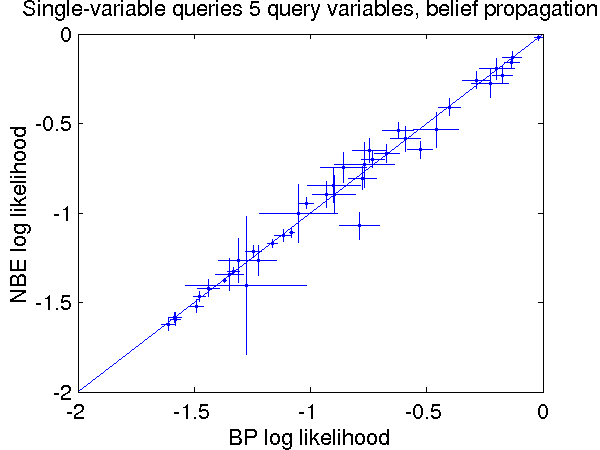
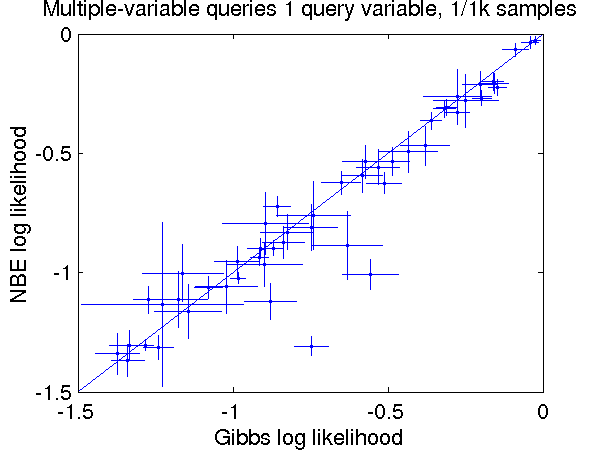
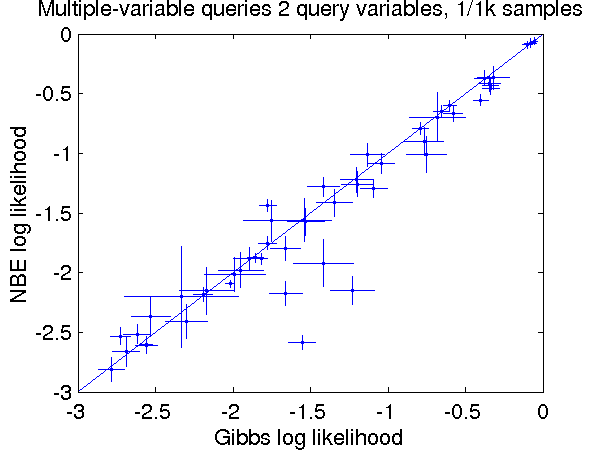
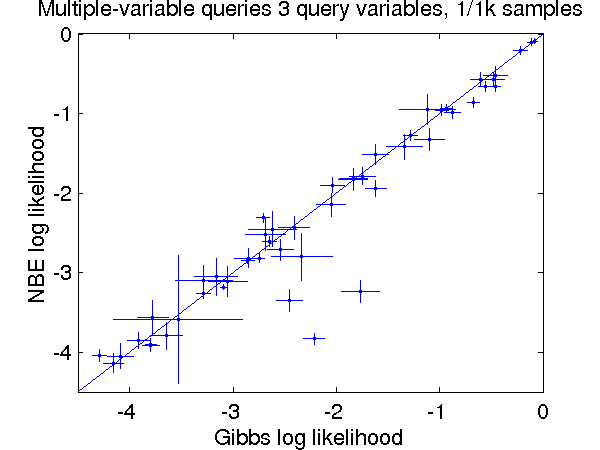
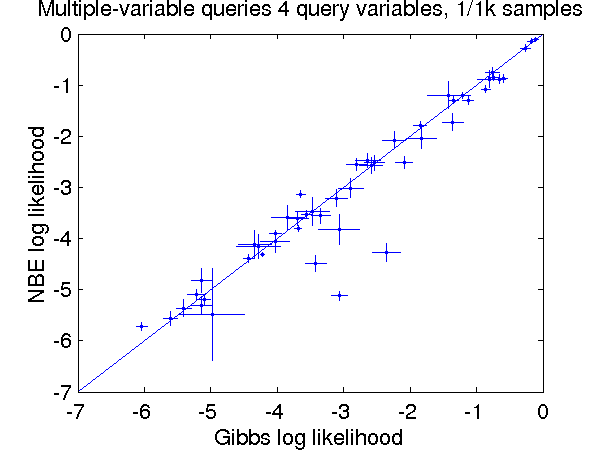
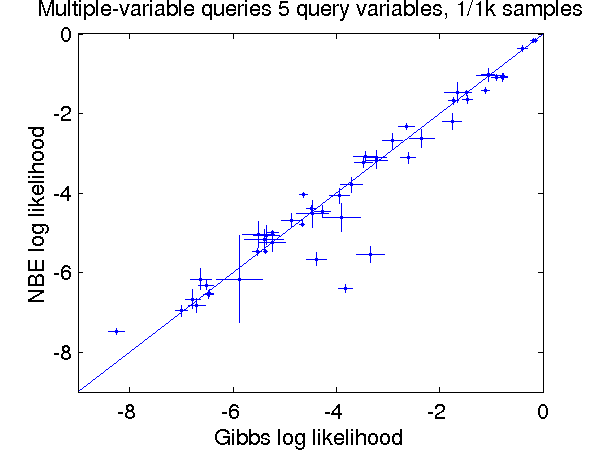
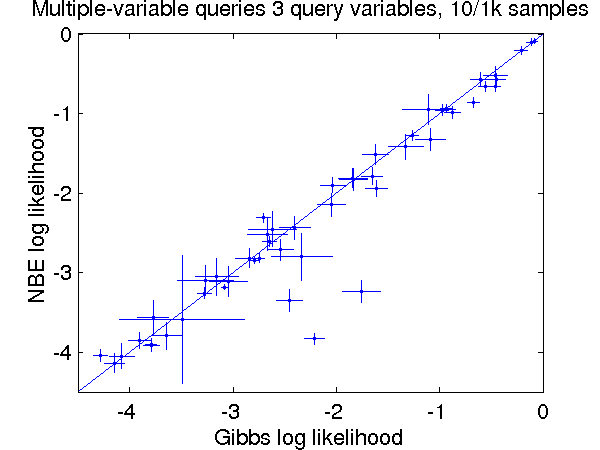
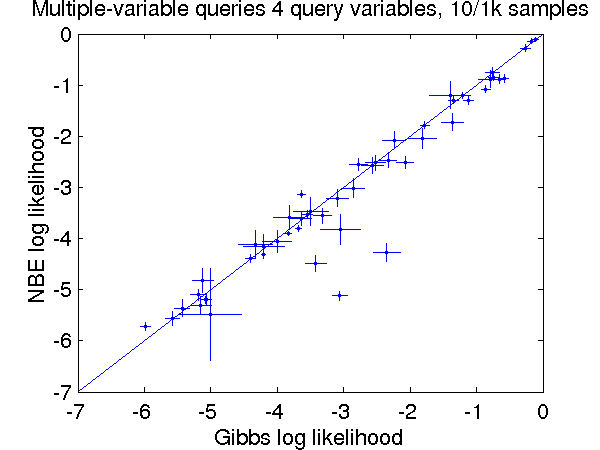
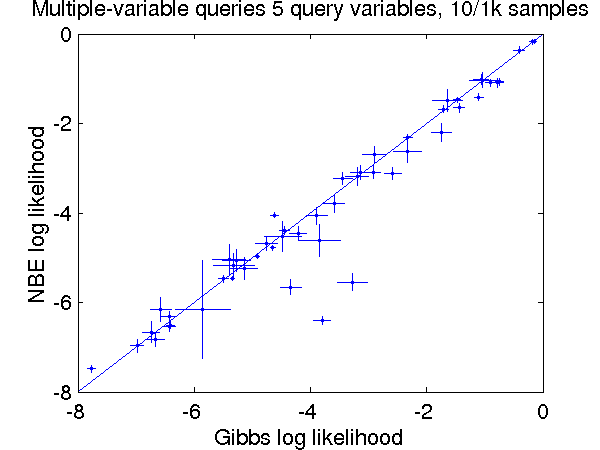
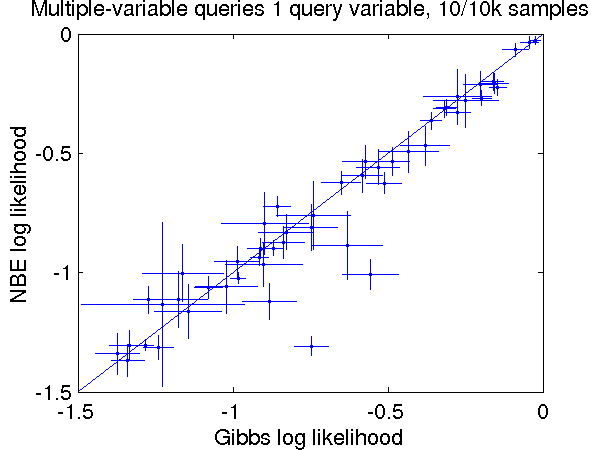
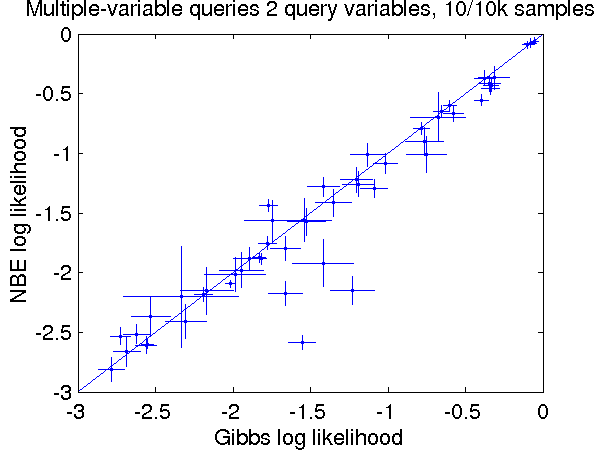
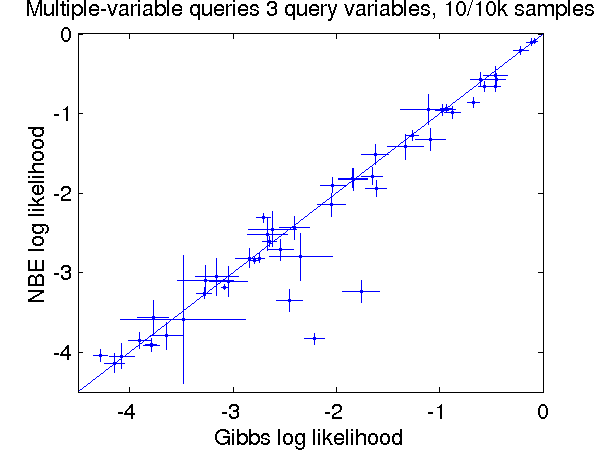
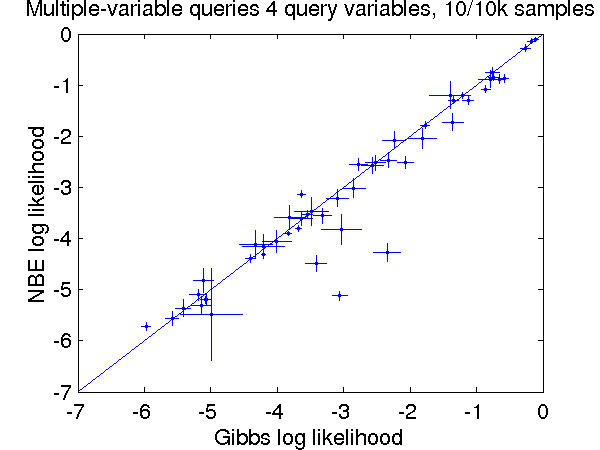
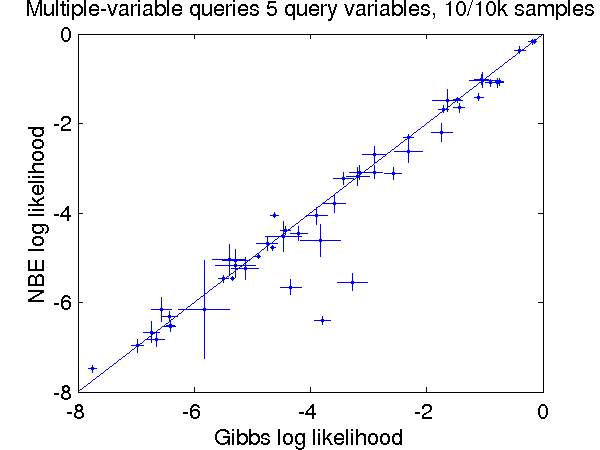
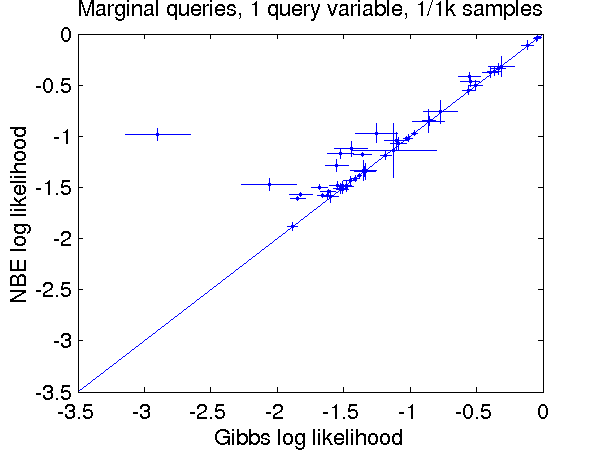
This page contains graphs comparing NBE log likelihood to that of Gibbs sampling or belief propagation on WinMine models, for each of 50 scenarios. The scenarios primarily differ in the number of query and free variables. Each graph corresponds to one of the cells in Table 3. See the paper for more details on each scenario.

The error bars on each data point represent four standard deviations (two in each direction). Each graph also contains the line y=x, for comparison. Some differences that do not appear statistically significant are significant by other measures (e.g., paired t-test).

To see the raw graph directory, click here.

Marginal queries

Gibbs sampling: 1 chain of 1,000 samples


1 variable


2 variable


3 variable


4 variable


5 variable


Gibbs sampling: 10 chains of 1,000 samples


1 variable


2 variable


3 variable


4 variable


5 variable


Gibbs sampling: 10 chains of 10,000 samples


1 variable


2 variable


3 variable


4 variable


5 variable


Single-variable queries

Gibbs sampling: 1 chain of 1,000 samples


1 variable


2 variable


3 variable


4 variable


5 variable


Gibbs sampling: 10 chains of 1,000 samples


1 variable


2 variable


3 variable


4 variable


5 variable


Gibbs sampling: 10 chains of 10,000 samples


1 variable


2 variable


3 variable


4 variable


5 variable


Belief propagation


1 variable


2 variable


3 variable


4 variable


5 variable


Multiple-variable queries

Gibbs sampling: 1 chain of 1,000 samples


1 variable


2 variable


3 variable


4 variable


5 variable


Gibbs sampling: 10 chains of 1,000 samples


1 variable


2 variable


3 variable


4 variable


5 variable


Gibbs sampling: 10 chains of 10,000 samples


1 variable


2 variable


3 variable


4 variable


5 variable


Comments to Daniel Lowd (lowd at cs dot washington dot edu)